

S Ahmad
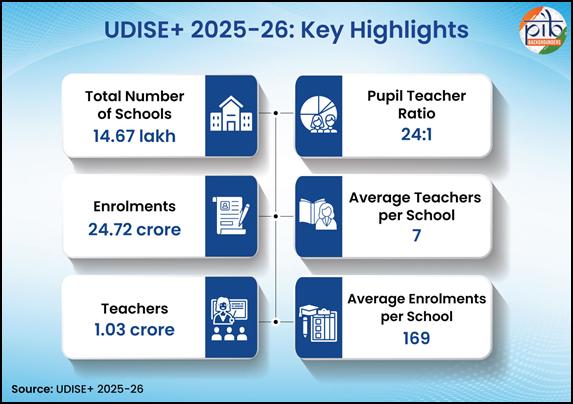
The UDISE+ Report 2025–26 presents a comprehensive assessment of school education in India, covering 14.67 lakh schools, 1.03 crore teachers, and 24.72 crore students. It highlights improvements in enrolment, Gross Enrolment Ratio (GER), teacher availability, pupil–teacher ratios, retention and transition rates, alongside reduced dropout rates. The report also records progress in digital and physical infrastructure, greater participation of women teachers, and continued advances in gender equity, social inclusion, and accessible education, reinforcing evidence-based planning under NEP 2020.
Education systems are often judged by what can be seen: the number of schools built, teachers appointed, children enrolled, classrooms constructed and examinations conducted. Yet behind every such measure lies a more fundamental question: how well does the system know itself?
A country as large and diverse as India cannot plan its school education system on broad assumptions alone. It needs to know where students are enrolled, where they are dropping out, which schools have too few teachers, where infrastructure is inadequate, how girls and disadvantaged communities are participating, and whether children are successfully moving from one stage of education to the next.
This is where data becomes more than a collection of numbers.
The Unified District Information System for Education Plus, or UDISE+, has increasingly become an important instrument through which India understands and manages its vast school education system. Developed by the Department of School Education and Literacy, UDISE+ has evolved since 2018-19 into a comprehensive digital platform for collecting and managing school-level information. The system is designed to support planning, policymaking, monitoring and evidence-based interventions. The Ministry of Education describes UDISE+ as a major national education management information system, with data submitted by recognised schools and subjected to validation at different administrative levels.
Its importance has grown further with the National Education Policy (NEP) 2020, which places universal access, equity, quality and retention at the centre of India’s educational aspirations.
The latest UDISE+ 2025-26 figures, as provided in the source material, present a picture of a school system making progress on several fronts. Nearly 14.67 lakh schools, 1.03 crore teachers and more than 24.72 crore students form an educational network of extraordinary scale. The overall pupil-teacher ratio stands at 24:1, while stage-wise ratios are even more favourable.
But the real significance of these numbers is not that they look impressive.
It is that they can tell policymakers where progress is happening, where it is incomplete and where intervention is needed.
That is the real promise of data-driven governance.
From counting schools to understanding students
For much of India’s educational history, data collection was often seen as an administrative exercise. Numbers were collected, reports prepared and tables compiled. The challenge was not simply the availability of information but its timeliness, accuracy and usefulness.
UDISE+ represents a significant shift in that approach.
The platform enables schools to submit information digitally, with validation and verification taking place at block, district and state levels. The system has also evolved towards student-wise data collection. According to the Ministry’s UDISE+ documentation, individual student-level data collection at the national level began from 2022-23, supporting the tracking of enrolment and students who may leave school.
That transition matters enormously.
A school system can know how many children are enrolled without necessarily knowing enough about what happens to individual children over time. Student-wise data allows governments to move towards a more precise understanding of educational journeys.
A child who disappears from one school’s records should not simply disappear from the education system.
The policy objective should be to know whether that child transferred to another school, dropped out, moved to another location or needs assistance to return.
This is precisely the kind of tracking envisaged under NEP 2020’s emphasis on universal participation.
The transformation, therefore, is not merely technological. It is conceptual.
The question changes from “How many children are in school?” to “What is happening to each child within the education system?”
That is a much more meaningful question for governance.
A school system of extraordinary scale
India’s school education network is among the largest in the world. The scale alone makes effective governance difficult.
According to the UDISE+ 2024-25 official figures, the system comprised nearly 14.71 lakh schools, more than 1.01 crore teachers and nearly 24.69 crore students.
The figures provided for 2025-26 indicate the continuing scale of this system, with nearly 14.67 lakh schools, 1.03 crore teachers and more than 24.72 crore students.
Behind these numbers are enormous differences in geography, demography and institutional capacity.
A school in a major city and a school in a remote rural area may operate under completely different circumstances. Some institutions have abundant infrastructure and digital connectivity; others may still struggle with basic facilities. Some have large teaching staffs; others operate with very few teachers.
A national average can conceal these differences.
That is why the value of UDISE+ lies not merely in producing an all-India figure but in allowing information to be examined across stages, regions, categories and individual schools.
Good governance begins when averages are supplemented by detail.
The pupil-teacher ratio: a number with a human meaning
One of the most frequently cited education indicators is the pupil-teacher ratio, or PTR.
At the national level, the 2025-26 material puts the overall PTR at 24:1, comfortably within the NEP 2020 benchmark of 30:1.
At different stages, the ratios are even more favourable: 10:1 at the Foundational stage, 12:1 at the Preparatory stage, 17:1 at the Middle stage and 21:1 at the Secondary stage.
These figures suggest a substantial improvement in teacher availability.
But PTR should not be treated as a standalone measure of educational quality.
A favourable national ratio does not automatically guarantee that every classroom has the right number of teachers. Nor does it tell us whether teachers have the appropriate subject expertise, whether they are present regularly, or whether they have adequate support and training.
This is where data-driven governance must become more sophisticated.
The question should not stop at how many teachers exist. It should ask where those teachers are, which subjects they teach, whether particular schools face shortages and whether deployment corresponds with student needs.
The decline in single-teacher schools offers one indication of progress. In 2025-26, the number of single-teacher schools fell by approximately three per cent to 1,00,843.
That is encouraging, but the remaining number is still substantial.
Each single-teacher school represents a different administrative challenge. The solution may involve recruitment in one place, rationalisation in another, better deployment elsewhere or innovative use of digital and shared teaching resources.
Data can identify the problem.
Governance must then act on it.
Access is not the same as completion
One of the most important messages emerging from the UDISE+ figures concerns student retention and transition.
The school system’s success cannot be measured only by the number of children who enter it. The more important question is how many remain, progress and complete successive stages of education.
The 2025-26 figures indicate improvement in dropout rates, with the rate declining to 1.8 per cent at the Preparatory stage and 7.0 per cent at the Secondary stage. The Middle stage recorded a dropout rate of 3.6 per cent.
Retention rates were reported at 98.5 per cent for the Foundational stage, 91.1 per cent for Preparatory, 83.7 per cent for Middle and 51.9 per cent for Secondary.
Transition rates were also strong: 99.2 per cent from Foundational to Preparatory, 93.8 per cent from Preparatory to Middle and 88.3 per cent from Middle to Secondary.
These figures point towards an important achievement: children are increasingly remaining within the education system and moving through its stages.
But they also reveal where the greater challenge lies.
The sharp difference between retention at the earlier stages and the Secondary stage deserves continued policy attention.
Secondary education is where many pressures can converge—economic circumstances, distance from school, family responsibilities, social expectations, academic difficulty and the attraction of entering the workforce.
The policy challenge, therefore, is not simply to bring children into school but to make remaining in school possible and worthwhile.
Data can show where the system is losing students.
The next task is to understand why.
The last child matters more than the national average
One danger of celebrating national education statistics is that averages can create a misleading sense of completion.
A 99 per cent figure may be impressive, but the one per cent outside the system still represents hundreds of thousands of children when the denominator is enormous.
This is why UDISE+ can become particularly powerful when used to identify the last-mile gaps.
The decline in zero-enrolment schools by 29 per cent to 5,663 is encouraging. It suggests better alignment between school availability and actual student demand.
But zero-enrolment schools also raise questions about planning.
Are schools located where children actually live? Has population movement changed local demand? Are some schools underused because families prefer other institutions? Are resources being deployed efficiently?
Data should not merely justify existing arrangements. It should challenge them.
A school system that has accurate information can rationalise resources without compromising access. It can identify surplus capacity in one area and shortages in another. It can decide where infrastructure needs expansion and where existing facilities require redesign.
That is governance based on evidence rather than assumption.
Gender inclusion is more than enrolment
The 2025-26 data also points to a relatively balanced gender distribution, with girls accounting for 48.4 per cent of total enrolment. Women constitute 54.9 per cent of teachers.
These figures are significant because the presence of girls in classrooms and women in the teaching workforce has implications beyond simple representation.
Girls’ education is closely connected to broader social and economic outcomes. Women’s participation in teaching also provides students with role models and contributes to a more diverse educational environment.
But gender parity should not be reduced to a percentage.
Policymakers must continue asking whether girls have equal access to every stage of education, particularly at the secondary level. They must examine attendance, transition, retention, safety, sanitation, transport and the availability of suitable learning environments.
The infrastructure figures are relevant here.
Girls’ toilets are available in 98.5 per cent of schools, while boys’ toilets are available in 97.2 per cent. Safe drinking water is available in 99.5 per cent of schools, and handwashing facilities in 96.9 per cent.
These are not merely infrastructure statistics.
For a girl deciding whether she can comfortably remain in school, the availability of sanitation facilities can be a practical determinant of attendance.
This is where data becomes human.
Inclusion must reach the classroom
The social composition of school enrolment provides another window into the country’s educational landscape.
According to the material supplied, OBC students constitute 44.9 per cent of enrolment, followed by General-category students at 27.5 per cent, Scheduled Castes at 17.7 per cent and Scheduled Tribes at 10 per cent.
SC and ST students together account for 27.7 per cent of enrolment.
Such data is important because educational equity cannot be assessed without knowing who is participating.
But representation in enrolment is only the beginning.
True inclusion means that students from different social backgrounds have meaningful opportunities to learn, progress and succeed. It requires attention to affordability, language, geography, discrimination, digital access, learning support and the ability to continue education through successive stages.
The same principle applies to Children with Special Needs.
The reported CWSN composition—57.16 per cent boys and 42.84 per cent girls—provides useful demographic information. But inclusion requires much more than counting children.
A genuinely inclusive school must be physically accessible, pedagogically responsive and socially welcoming.
Ramps with handrails, for instance, are available in 58.2 per cent of schools according to the supplied data.
That figure is a reminder that infrastructure gaps remain even as overall school facilities improve.
The objective should be to move from nominal inclusion to functional inclusion.
The digital school is no longer optional
Perhaps nowhere is the transformation of the education system more visible than in digital infrastructure.
In 2025-26, the proportion of schools equipped with computers rose to 69.9 per cent, while internet connectivity reached 67.4 per cent.
These figures indicate substantial progress, but they also reveal a significant unfinished agenda.
In a country increasingly dependent on digital platforms for education, administration and access to information, the absence of computers or reliable connectivity can create a new form of inequality.
The digital divide is no longer simply about whether a child owns a smartphone.
It is also about whether the school has functioning digital infrastructure, whether teachers know how to use it effectively, whether students can access quality educational content and whether connectivity is reliable enough to support learning.
A computer in a school does not automatically create digital education.
The infrastructure must be accompanied by teacher training, relevant content, technical support and meaningful classroom integration.
Otherwise, technology risks becoming another statistic rather than a transformative educational tool.
Basic infrastructure remains the foundation
The fascination with artificial intelligence, smart classrooms and digital learning should not obscure the continuing importance of basic facilities.
Education begins with a safe and functional physical environment.
The supplied UDISE+ figures show electricity availability in 95 per cent of schools, safe drinking water in 99.5 per cent, girls’ toilets in 98.5 per cent, boys’ toilets in 97.2 per cent, handwashing facilities in 96.9 per cent and libraries in 90.5 per cent.
Rainwater harvesting is reported in 29.9 per cent of schools, while ramps with handrails are available in 58.2 per cent.
The pattern tells an important story.
India has made substantial progress in basic school infrastructure, but the remaining gaps are increasingly concentrated in areas where quality and sustainability intersect.
Water availability, sanitation, accessibility, libraries and digital facilities all affect learning conditions.
Rainwater harvesting is an especially interesting indicator because it connects education infrastructure with environmental sustainability. Schools can become places where students do not merely learn about environmental responsibility but experience it through the design and management of their own campuses.
Data must lead to action
There is, however, a danger in becoming too impressed by data systems themselves.
A sophisticated database does not automatically produce better governance.
The value of UDISE+ lies in what governments, administrators, teachers and communities do with the information.
If the data identifies a concentration of single-teacher schools, there must be a strategy to address it.
If dropout rates remain higher at the Secondary stage, interventions must be designed around the reasons students leave.
If digital connectivity remains uneven, investments must target the schools that are behind rather than simply increasing national averages.
If accessibility infrastructure is inadequate, CWSN data should guide targeted improvements.
If zero-enrolment schools are declining, the information should inform future planning of school locations and resource allocation.
This is the difference between data collection and data-driven governance.
The first produces reports.
The second changes decisions.
The next frontier: from infrastructure to learning
The UDISE+ numbers are particularly encouraging on access, teacher availability, infrastructure and retention. But the ultimate purpose of education is learning.
A school can have a good pupil-teacher ratio, electricity, computers, internet connectivity and a library—and still fail to produce strong learning outcomes.
This is perhaps the next major challenge for India’s data-driven education governance.
The country needs to increasingly connect information about inputs with information about outcomes.
How does teacher availability affect learning? Which interventions reduce dropout? Which infrastructure investments make the greatest difference? What support helps students who fall behind? Which schools are succeeding despite difficult circumstances, and what can others learn from them?
These are harder questions.
They require moving beyond administrative data towards deeper educational analysis.
UDISE+ provides an important foundation for that transition because it creates a common national information architecture. The official system already describes itself as a central platform for school profiles, infrastructure, individual students and teacher information, with validation across administrative levels.
The next step is to make the information increasingly useful for decision-making at the classroom and school level.
Data should empower teachers, not burden them
There is another dimension that deserves attention.
Every data system depends on the people who enter and maintain the information.
Teachers and school administrators should not be overwhelmed by reporting requirements at the expense of teaching. The purpose of educational data collection must ultimately be to support educators, not turn them into data-entry personnel.
The more efficiently UDISE+ can integrate information, reduce duplication and make data useful to schools themselves, the greater its value will become.
A teacher should be able to see how information about attendance, progression or infrastructure can help improve the school—not merely understand that the information must be uploaded for administrative compliance.
Data governance becomes sustainable when the people generating the data can see its value.
A new culture of educational accountability
Perhaps the most important contribution of UDISE+ is cultural.
Data makes it harder to hide disparities behind broad claims of progress.
It allows questions to be asked with greater precision.
Why does one district have a higher dropout rate than another?
Why does one category of school have significantly lower digital connectivity?
Why do some schools remain single-teacher institutions?
Why are transition rates weaker at a particular stage?
Why does infrastructure remain uneven?
Such questions create accountability.
But accountability should not mean simply identifying failure. It should also mean identifying success.
If a district has successfully reduced dropout, its methods can be studied. If one state has improved teacher deployment, its experience can inform others. If a school has developed an effective model for inclusion, that model can potentially be adapted elsewhere.
In this sense, data allows education governance to become a process of continuous learning.
The numbers tell a story—but not the whole story
The UDISE+ 2025-26 figures present a broadly encouraging picture of India’s school education system.
Teacher availability has strengthened. Pupil-teacher ratios are favourable. Dropout rates have declined in important stages. Transition rates remain strong. Girls represent nearly half of enrolment. Women form a majority of the teaching workforce. Basic infrastructure is widespread. Digital connectivity is expanding. Single-teacher and zero-enrolment schools are declining.
These are meaningful achievements.
But numbers should inspire the next question, not end the conversation.
A 67.4 per cent internet-connectivity rate asks what happens in the remaining schools.
A 58.2 per cent availability of ramps with handrails asks what happens to children who still face physical barriers.
A 51.9 per cent Secondary-stage retention rate asks why students are still being lost at the most critical stage of schooling.
More than one lakh single-teacher schools ask whether teacher deployment is sufficiently responsive.
And every child who leaves school asks whether the system knows where that child went and what support might bring them back.
This is why UDISE+ matters.
Its greatest achievement may not be the sheer volume of data it contains. It may be the possibility of making India’s education system more self-aware.
From a database to a governance instrument
India’s educational ambitions under NEP 2020 are enormous. Universal access, equity, quality and learner-centred education cannot be achieved through policy declarations alone.
They require knowledge.
Governments need to know where the gaps are. Administrators need to know which interventions work. Teachers need support based on actual classroom realities. Communities need greater transparency about the institutions serving their children.
UDISE+ can help provide that foundation.
But the future of education governance will depend on how intelligently that foundation is used.
The country must move from asking whether data has been collected to asking whether the data has changed a decision.
Has a teacher been deployed where the data showed a shortage?
Has a school received infrastructure because the database identified a gap?
Has a student been brought back because tracking revealed a dropout?
Has an intervention been redesigned because the numbers showed it was not working?
Has a successful local model been scaled because the evidence demonstrated its effectiveness?
Those are the questions that will determine whether data-driven governance becomes a genuine transformation or simply a more sophisticated form of record-keeping.
India has built one of the world’s largest school education information systems. The challenge now is to extract its full public value.
The future should not be about producing more numbers for their own sake. It should be about converting numbers into insight, insight into policy, policy into action and action into better opportunities for children.
That is the real journey from UDISE+ to better governance. And ultimately, the success of India’s education data revolution will not be measured by how many records sit inside a national database. It will be measured by what happens to the child sitting in the classroom.
The article is based on the inputs and background information provided by the Press Information Bureau (PIB). Author is Writer, Policy Commentator. He can be mailed at kcprmijk@gmail.com
Comments are closed.